
 BY amfcon
 Life insurance is generally thought of as a way to provide financial protection for your dependents after your death. In other words, most people perceive it as a death benefit. BUT some life insurance policies combine a death benefit with investment components. Index Universal Life (IUL) insurance is one of these policies which have a cash accumulation component similar to an Indexed Annuity.
Literally, you can call it an “IUL Investment Plan” and it is the future 401(k) retirement plan. The investment component of this plan allows the policy owner to place funds in an underlying market index providing growth potential for the cash account within the IUL policy. Principal guarantees include protection (Graph 1(b)) of accumulated premiums and growth from the year before the market declined (Graph 1(a)). Some of the most common indexes that are used within IUL policy include the S&P 500, S&P MidCap 400, NASDAQ 100, DJIA, Russell 200, Barclays Trailblazer Sector 5, Fixed Rate, and EURO. Funds can be allocated in any combination by the policy owner.
On Oct 3, 2022, Dr. Edward Burns Jr wrote an article in Forbes, “Why Indexed Universal Life Insurance Might Be The New 401(k) – Investors are always looking for ways to save money during inflation. Putting their money into indexed universal life (IUL) insurance policies and over time, this model has developed into an increasingly viable alternative to both whole life insurance as well as 401(k)s. Many major companies invest so much of their stock in life insurance because they understand the power of compounded interest.” <https://www.forbes.com/sites/forbesbusinessdevelopmentcouncil/2022/10/03/why-indexed-universal-life-insurance-might-be-new-401k/?sh=1a585a5b60c9>
Table 3 compares both policies’ performance from 1999 to 2022. It is very helpful to understand what happens when the market falls down and what percentage it takes to recover the losses. Next, I will explain why Indexed plans perform better than S&P 500 plans or 401(k) plans. The magic thing is “ZERO LOSS.” It all has to do with the percentage of loss and percentage of recovery, and how long it takes for recovery.
| YEAR | S&P 500 ROR | Premium $20K/Yr | S&P 500/401(k) TOTAL CASH | YEAR | IUL CAP & Floor Value | Premium $20K/Yr | INDEXED PLAN (IUL) TOTAL CASH | |
| 1999 | 21.04% | $18,000 | $21,427.20 | 1999 | 12.00% | 18,000 | $19,756.80 | |
| 2000 | -9.10% | $18,000 | $35,050.78 | 2000 | 0.00% | 18,000 | $37,001.66 | |
| 2001 | -11.89% | $18,000 | $45,682.03 | 2001 | 0.00% | $18,000 | $53,901.63 | |
| 2002 | -22.10% | $18,000 | $48,334.66 | 2002 | 0.00% | $18,000 | $70,463.60 | |
| 2003 | 28.69% | $18,000 | $84,039.38 | 2003 | 12.00% | $18,000 | $98,676.03 | |
| 2004 | 10.88% | $18,000 | $111,100.48 | 2004 | 10.88% | $18,000 | $128,971.21 | |
| 2005 | 4.91% | $18,000 | $132,857.30 | 2005 | 4.91% | $18,000 | $153,809.82 | |
| 2006 | 15.79% | $18,000 | $171,660.52 | 2006 | 12.00% | $18,000 | $192,023.80 | |
| 2007 | 5.49% | $18,000 | $196,279.67 | 2007 | 5.49% | $18,000 | $221,174.35 | |
| 2008 | -37.00% | $18,000 | $130,710.60 | 2008 | 0.00% | $18,000 | $238,814.35 | |
| 2009 | 26.45% | $18,000 | $185,070.34 | 2009 | 12.00% | $18,000 | $287,228.87 | |
| 2010 | 15.06% | $18,000 | $229,591.33 | 2010 | 12.00% | $18,000 | $341,453.13 | |
| 2011 | 2.11% | $18,000 | $247,863.68 | 2011 | 2.11% | $18,000 | $366,670.00 | |
| 2012 | 16.00% | $18,000 | $303,084.60 | 2012 | 12.00% | $18,000 | $430,427.20 | |
| 2013 | 32.39% | $18,000 | $418,662.20 | 2013 | 12.00% | $18,000 | $501,835.26 | |
| 2014 | 13.69% | $18,000 | $487,708.02 | 2014 | 12.00% | $18,000 | $581,812.29 | |
| 2015 | 1.38% | $18,000 | $502,572.63 | 2015 | 1.38% | $18,000 | $607,724.73 | |
| 2016 | 11.96% | $18,000 | $572,421.66 | 2016 | 11.96% | $18,000 | $700,158.36 | |
| 2017 | 21.83% | $18,000 | $707,502.27 | 2017 | 12.00% | $18,000 | $803,934.16 | |
| 2018 | -4.38% | $18,000 | $679,215.23 | 2018 | 0.00% | $18,000 | $821,574.16 | |
| 2019 | 31.49% | $18,000 | $902,824.00 | 2019 | 12.00% | $18,000 | $939,919.86 | |
| 2020 | 18.40% | $18,000 | $1,071,839.14 | 2020 | 12.00% | $18,000 | $1,072,467.04 | |
| 2021 | 28.71% | $18,000 | $1,380,935.17 | 2021 | 12.00% | $18,000 | $1,220,919.88 | |
| 2022 | -16.14% | $18,000 | $1,145,168.33 | 2022 | 0.00% | $18,000 | $1,214,141.49 |
Table 1: 401(k) and Indexed Plan Performance
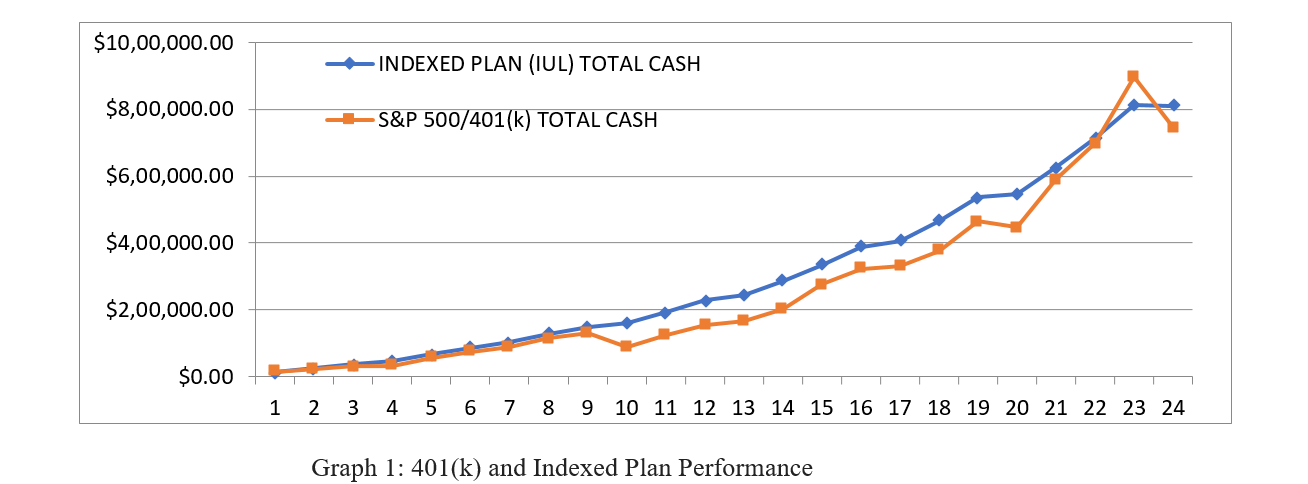
Graph 1 shows, it took 20 years for 401(k) to catch up with IUL investments. In 2022, with the market downturn, an IUL investment plan surpassed a 401(k) retirement plan.